
17.6 Fermenter growth kinetics
You will note that Table 5 (on the previous page) specifies both temperature and nature of the medium. This is necessary because environmental conditions influence the rate of growth of the cells in culture, and therefore the value of any parameter derived from slope of the exponential part of the growth curve. Temperature is an obvious determinant of growth rate, and that’s why foodstuffs are refrigerated to keep them fresh; the low temperature slows the growth of microorganisms so much that the food is preserved for longer than its ‘shelf-life’ at normal temperatures. Every other feature of the culture environment also influences growth rate, including factors like pH, gas exchange, and, for photosynthetic organisms, illumination too.
However, in most fungal cultures it is the nutrients that matter most (assuming the temperature is adequate). And that means all nutrients. The maximum specific growth rate (μmax) can only be attained if all nutrients are present in excess. If supplies of a nutrient are inadequate, that nutrient is described as being limiting, because the diminished supply limits the growth rate to a suboptimal value. We illustrate this in Fig. 12, which shows the effect of different initial concentrations of glucose in the medium on the growth rates of fungal batch cultures, but we are using the sugar simply as an example; any other nutrient, whether it be mineral or organic, carbon source, nitrogen source, or sulfur source, could serve in this example although the shape of the curve shown in Fig. 12 is likely to be different for non-carbon source nutrients because of the complication caused by unbalanced growth.
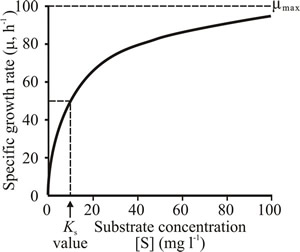 |
Fig. 12. Substrate-limited growth of microorganisms. Effect of different initial concentrations of glucose in the medium on the growth rates of fungal batch cultures. Ks is the substrate concentration that supports the half-maximal growth rate. In this graph, specific growth rate (µ) of the culture is plotted as a (hyperbolic) function of substrate concentration. |
|---|
The curve shown in Fig. 12 is very similar to the (Michaelis-Menten) single-substrate progress curve that describes the rate of an enzyme reaction (usually symbolised v) as a function of substrate concentration (usually symbolised [S], the square brackets indicating that the term is a concentration); so by analogy with the Michaelis constant (Km) of enzyme kinetics, the substrate concentration that supports the half-maximal growth rate is symbolised Ks. This is indicated in Fig. 12. Monod (1942) was the first to realise that when the concentration of a nutrient (such as glucose) decreases, it eventually falls to a level which causes a decrease in specific growth rate of the culture (as shown in Fig. 12).
Monod suggested that uptake of the limiting nutrient is regulated by an enzyme (a permease) and that the form of the relationship between nutrient concentration and specific growth rate was similar to the effect of substrate concentration upon the rate of an enzyme catalysed reaction. The Ks of a microorganism for a nutrient may reflect the effect of nutrient concentration on the permease protein responsible for its uptake.
The Michaelis-Menten relationship for the effect of substrate concentration on the rate of an enzyme catalysed reaction is given by the equation:
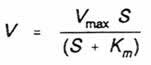
where V = rate of reaction, Vmax = maximal rate of reaction, S =
substrate concentration,
and Km = substrate concentration at which reaction rate = 0.5 Vmax.
The analogous Monod equation for effect of substrate concentration on the specific growth rate of a microorganism is as follows:
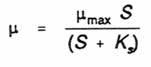
where µ = specific growth rate, µmax = maximum specific growth rate in absence of substrate limitation, S = concentration of growth limiting substrate, Ks = substrate concentration which allows the organism to grow at 0.5 µmax.
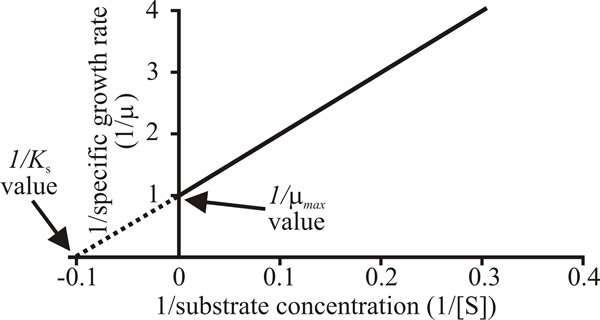
Extending this analogy with enzyme kinetics, where the reaction constants Vmax and Km are more effectively obtained from the double-reciprocal (Lineweaver-Burk) plot of 1/v × 1/[S], this Monod equation may be rearranged to give a linear function:
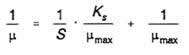
and replotting the data of Fig. 12 with a vertical axis (ordinate) of 1/µ and
horizontal axis (abscissa) of 1/s gives a straight line intercepting the
abscissa at 1/µmax and the ordinate at -1/Ks (Fig. 13).
 |
|---|
| Fig. 13. A Lineweaver-Burk plot of l/µ against 1/s. |
The Michaelis constant, Km, is a measure of the affinity of an enzyme for its substrate and by analogy the substrate concentration that allows the organism to grow at half maximal rate, Ks, is taken to be a measure of the affinity of the organism for the substrate. Microorganisms can show high affinities for nutrients. For example, the Ks of Fusarium venenatum for glucose measured as described above is 30 µM (= 5.4 mg 1-1).
A word of warning is necessary here because though this analogy with enzyme kinetics is a useful way of remembering the basic kinetics governing growth of liquid cultures, it has its limitations. In particular it is essential to stay aware that an enzyme reaction rate results from the interaction of a single enzyme with a single substrate whereas the growth rate of a culture, even if you are studying a single substrate, is the outcome of all the integrated metabolic interactions with the substrate and all of its diverse reaction products.
Nevertheless, a low Ks value is an important selective advantage as it allows the organism to grow rapidly even when nutrients like glucose are present in very low concentrations in nature. So the characteristically low Ks values observed indicate that microorganisms have evolved to prosper ecologically at low substrate concentrations. Consequences of low Ks values for such organisms in batch culture are that (a) they grow at µmax until almost all the glucose is used up, and (b) the deceleration phase of growth is over very quickly.
Maximum specific growth rate cannot be attained unless all nutrients (including gaseous oxygen) are provided in excess. Once reached, maximum specific growth rate cannot be maintained unless the culture is continually supplied with nutrients to replenish supplies as they are used, and unless waste products and other potentially toxic metabolites (including gaseous carbon dioxide) are removed.
Growth rate begins to decline (‘deceleration phase begins’) when a nutrient starts to become depleted, and growth continues to decelerate until the organism enters stationary phase when the nutrient becomes exhausted. In most media, the limiting nutrient is usually the carbon source (generally a sugar such as glucose or sucrose). In industrial scale fermenters, where high biomass densities are favoured to produce maximal quantities of product, oxygen can often be the limiting nutrient. With the exception of the strictly anaerobic rumen chytrids, fungi are generally aerobic organisms with an absolute requirement for oxygen for respiration and maximal growth.
So the onset of stationary phase of a culture in practice may be determined by:
- nutrient exhaustion (of, for example, glucose),
- lack of oxygen,
- accumulation of toxic metabolites
or any combination of any or all of these factors. Entry into stationary phase may also be caused by a change in the pH of unbuffered media, for example when ammonium sulfate is the nitrogen source.
Updated July, 2019