
2.4 Describing branching patterns
Having considered the kinetics of the branching process and its relationship to mycelial growth and biomass evolution, we now turn our attention to describing mycelial morphology. Once this has been reviewed, the mechanisms behind generating these morphologies are discussed.
Leopold (1971) examined the generality of natural branching systems in trees and streams. Based on the classification system of Horton (1945), she labelled each branch of a tree or river network depending on how many tributary branches it supported. Hence, first-order branches have no tributaries; second-order branches support only first-order branches; third-order branches support only first and second-order branches; etc. She also measured the lengths of each branch to obtain an average value for each order of branching (the length of an n-order branch includes the length of its longest (n-1)-order tributary).
She found that straight-line plots resulted when branch order was plotted against the logarithm of:
- the number of branches of a given order, and
- the average length of a branch of a given order.
The gradient of these lines was interpreted as (i) the branching ratio (BR = the average number of n-order branches for each (n+1)-order branch); and (ii) the length ratio (LR = the average length of each n-order branch as a multiple of the average length of each (n-1)-order branch). Observations suggest that the values of these ratios showed little variation over a range of tree species (BR = 4.7 - 6.5; LR = 2.5 - 3.6) and river networks (BR=3.5; LR=2.3).
Gull 1975 applied this analysis to the mycelial branching characteristics of the filamentous fungus, Thamnidium elegans, and observed branching and length ratios of 3.8 and 4.0, respectively, for a third-order system and 2.6 and 2.7 for a fourth-order system. Though it gave no biological insight into the mechanisms of branching, Gull’s work demonstrated that mycelia employ branching as a strategy for colonising the maximum area of space using the minimum total mycelial length, and indicate that the values obtained can be interpreted as a quantification of branching frequency.
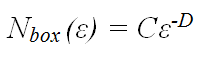
Another approach to quantifying branching frequency relies on the mathematics of fractal geometry. In the box-counting method of fractal analysis a grid of boxes, each with side length ε, is placed over the pattern, and the number of boxes, Nbox, that are intersected by the pattern is counted. If a pattern is fractal, it will be ‘self-similar’ at all scales. This means that a true fractal pattern has an infinite length. However, the geometry of the pattern limits the degree to which it can fill the plane. This is quantified in terms of the fractal dimension, D, according to the formula:
 |
(16) |
where C is a constant. A straight line has a fractal dimension, D = 1, and a completely filled plane has D = 2.
By looking at higher and higher resolutions (i.e. in the limit ε >0) the repeating pattern will be revealed to cover a limited proportion of the plane. When the logarithm of Nbox is plotted against the logarithm of (1/ε), a straight line is obtained with gradient equal to D. When applied to fungal mycelia, ε is limited by the hyphal diameter microscopically and by the mycelial diameter macroscopically. Thus, mycelia are not true fractals. However, this range is sufficient to allow reasonably accurate regression analysis for D, and thus quantification of the space filling capacity, or branching frequency, of mycelia can be obtained.
Obert et al. (1990) applied this method to mycelia of Ashbya gossypii. They found that mycelia did indeed behave as fractals, and calculated a fractal dimension, D = 1.94. Such a high value for D indicates a mature mycelium whose centre has been almost homogenously filled by branching hyphae. For the edge of mycelia they calculated D = 1.45. Thus, as a mycelium develops its fractal dimension converges towards 2 when the whole mycelium is considered and towards 1.5 when only the edge is considered. Ritz & Crawford 1990 and Jones et al. (1993) corroborated these findings.
Matsuura & Miyazima (1992, 1993) used a different form of fractal analysis to quantify the ‘roughness’ of the edges of mycelia grown at different temperatures and on different media. Unfavourable conditions (e.g. low temperature, low nutrient concentration or stiff (that is, high gel-strength) media) were found to produce rough edges corresponding to a lower branching frequency.
However, these applications are only able to quantify branching, and offer no insight into the mechanisms that might be generating the patterns. Mycelia growing on flat, uniform surfaces almost invariably grow into circular colonies. For this reason, much work has been invested in designing models that can produce this morphology. Such models are more complex and have developed alongside the development of computers and computer programming.
Cohen (1967) pioneered computer analysis by devising a program that was able to generate a range of branching patterns found in the natural world from a set of simple growth and branching rules. In his model growth occurred only at the tip and branching was only initiated behind the tip. Thus, it is directly applicable to mycelial growth of most fungi. Growth proceeded with respect to local density fields, calculated with reference to 36 sample points spaced 10° apart around the circumference of a circle centred on a growing tip, and quantifying the pattern density in the locality. Local density minima were key parameters that directed growth into unoccupied space. Branching probability was also made a function of local density minima. A random trial incorporated into the program decided, independently, if branch initiation should occur. Finally, the direction of both growth and branching were dependent on a ‘persistence factor’ that quantified to what degree they continued in the same direction in spite of gradients in the density field. When these rules were iterated, with the persistence factor for growth nullified (i.e. growing tips proceeded in a straight line), a circular branching pattern emerged.
Hutchinson et al. (1980) developed this work further by applying it directly to mycelial colonies of Mucor hiemalis. They determined the variability of tip growth rate, distance between branches, and branching angle throughout the colonies. They were then able to fit these data to known distribution curves with defined probability density functions. Tip growth rate was found to follow a half-normal distribution, distance between branches followed a gamma distribution, and branching angle followed a normal distribution. This formed the basis for a model in which values for the three specified variables were generated from the respective probability density functions over a series of time intervals.
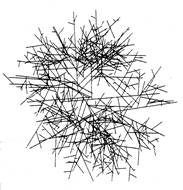 |
| A circular mycelium generated by the model of Hutchinson et al. (1980). |
Although this model includes no allowances for tropic interactions between hyphae, it generates a circular mycelium. This came as something of a surprise because it had been assumed that the fact that growing hyphae actively avoid each other played a role in determining spatial organisation in mycelia. Such avoidance strategies, known as negative autotropism, have been observed experimentally in several independent studies (e.g. Robinson, 1973a & b; Trinci et al., 1979; Hutchinson et al., 1980). Indermitte et al. (1994) constructed a similar random growth model that also generated circular colonies. They further tested how colony morphology and growth efficiency (the ratio of biomass used to area of medium covered) were affected by tropisms. Their results indicated that tropism increased the growth efficiency, but a circular colony was generated in all cases.
Updated December 7, 2016